Analytics and reporting
The analytics dashboard shows how the desk is doing: backlog, response and resolution times, SLA compliance and customer satisfaction, for any date range.
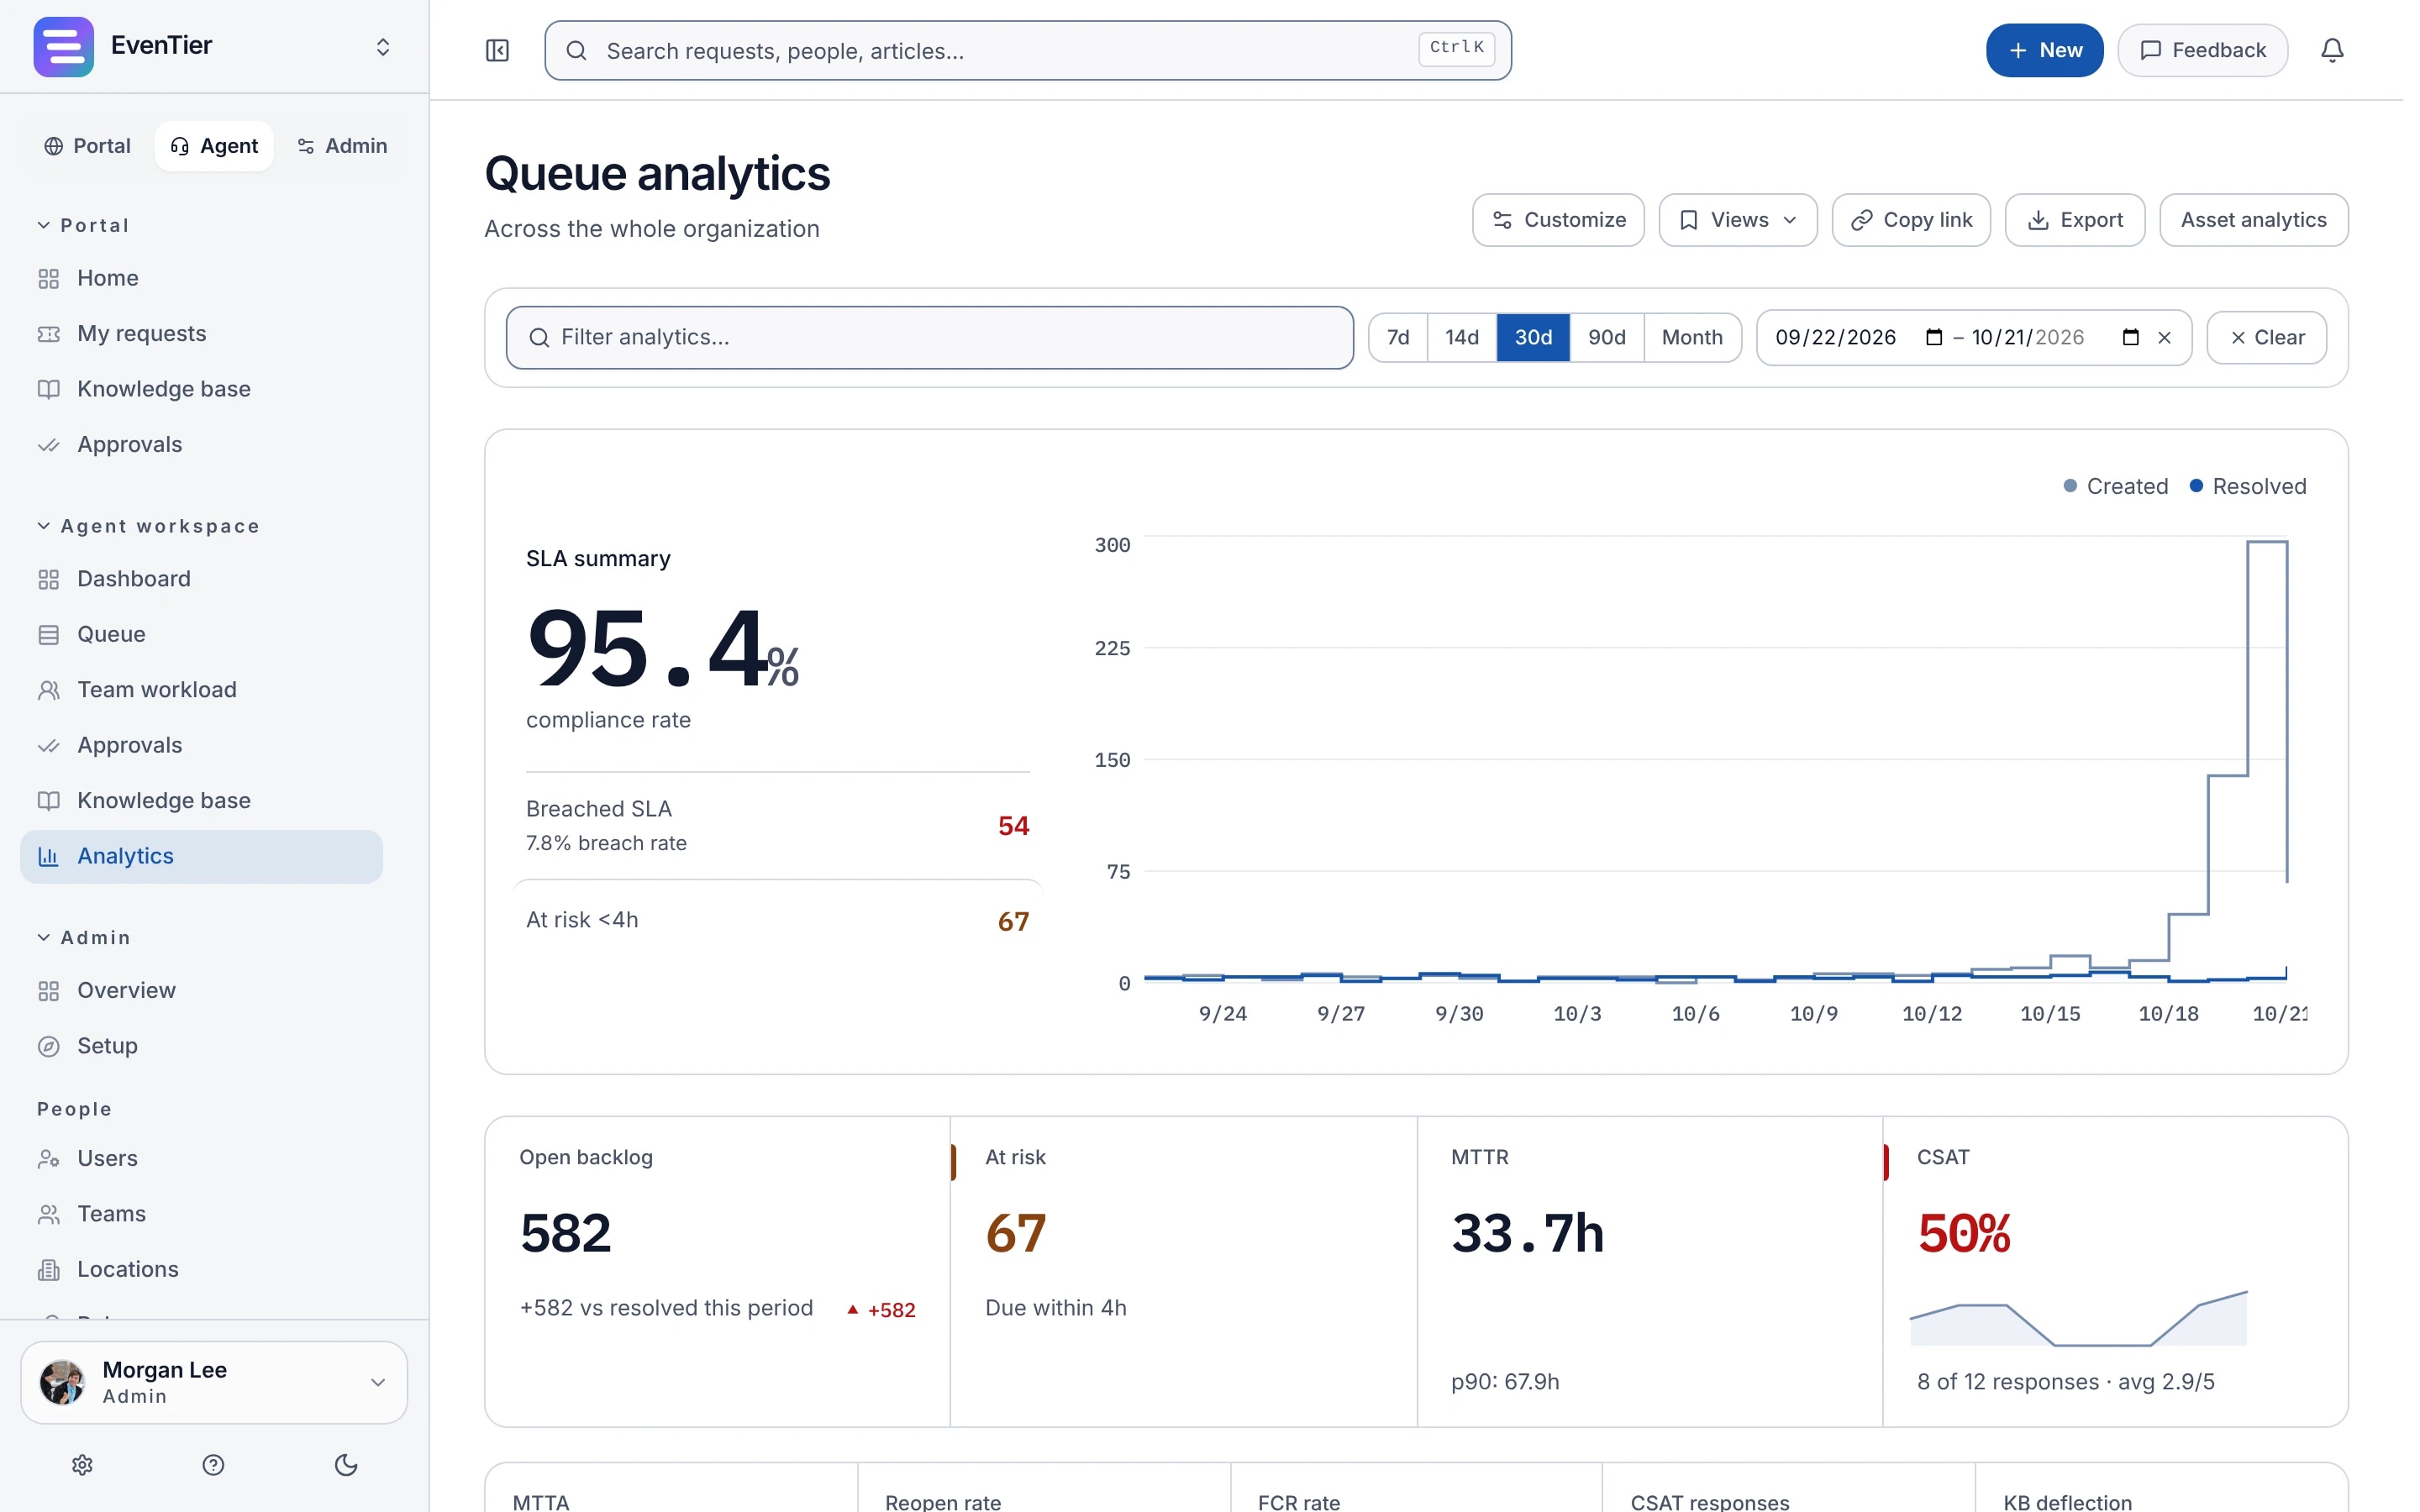
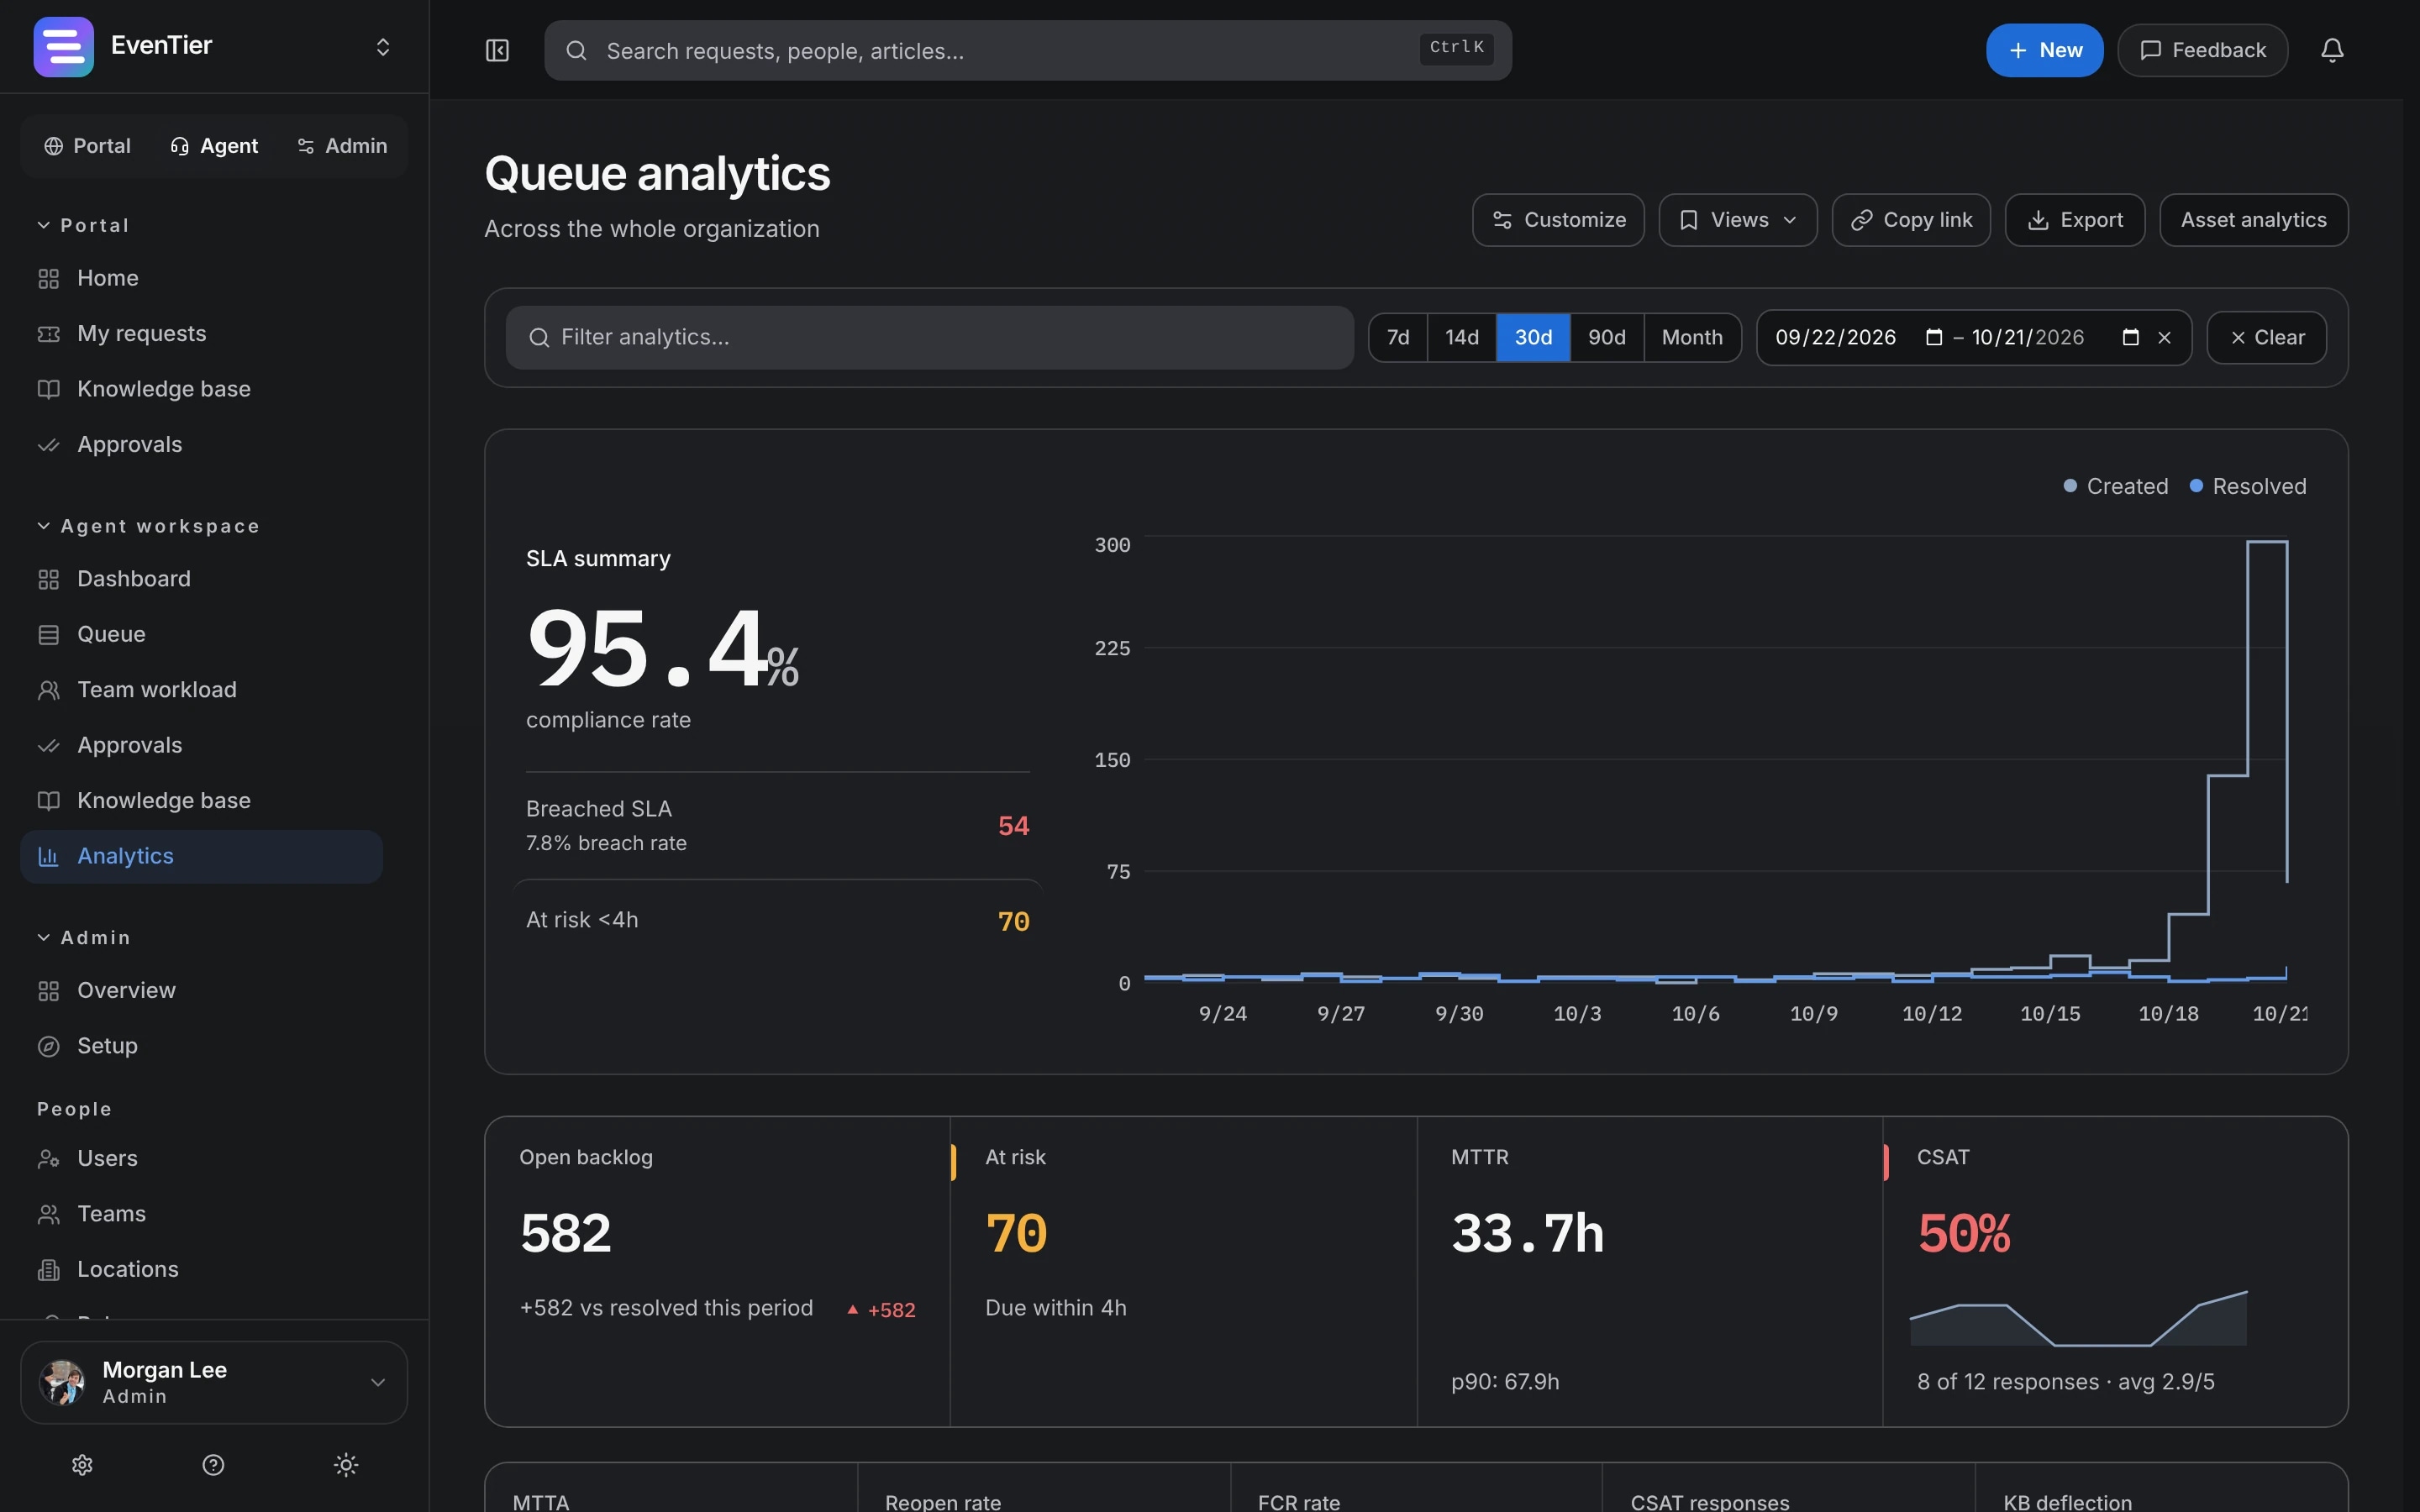
Dashboard figures
The top row shows open backlog, requests at risk, average resolution time and CSAT. Below it are first response time, reopen rate, first contact resolution and knowledge base deflection.
- Volume created and resolved per day, and requests by status, type, team and source
- SLA compliance over time, and the teams and request types with the most breaches
- Median and 90th percentile first response and resolution times
- Backlog aging, time spent in each status, top tags and top knowledge base searches
Filters and access
Pick a date range, then narrow by team, request type, priority, status or assignee. What each person sees follows their role, and confidential requests count only for people who can open them.
- Admins see the whole workspace
- Managers see their teams and can switch to their own performance
- Agents see their own numbers
Customer satisfaction
When a request is resolved, the requester is asked to rate it from 1 to 5 in one click and can leave a comment. The dashboard shows the score, its distribution and its trend, and Evee can summarize the comments by theme.
Workload, views and exports
The Team workload page lists each agent's presence and open requests by team. On the dashboard, each person can rearrange the panels, save the filters they use and export a report.
- Reports in CSV, PDF or PowerPoint
- Saved views, which admins can share with the whole workspace
- A backlog forecast based on recent volume
- The same numbers are available from the REST API
Included in every plan.See pricing →
Questions about Analytics
- Can we get the data into our own BI tool?
- Yes. Export reports to CSV, or create an API key that can only read analytics and call it from a spreadsheet, Grafana or your BI tool.
- How is CSAT calculated?
- Requesters rate a resolved request from 1 to 5. CSAT is the share of ratings that are 4 or 5, shown with the average score and the distribution.
- Can we schedule reports by email?
- Not yet. Export a report when you need it, or read the numbers from the API on your own schedule.
Documentation
- Analytics & reportingThe analytics dashboard, team workload, customer satisfaction (CSAT) surveys, saved views, and exports as CSV, PDF, or PowerPoint.
- REST APIWork with requests, comments, users, request types and analytics from your own scripts and tools. Calls use API keys, see one organization, and are rate limited.
Related
- SLAsResponse and resolution targets on business hours
- Requests and portalIntake forms, the employee portal and the agent queue
- Asset managementInventory, assignments and renewals, linked to requests
- Internal IT help deskIntake, routing, SLAs, approvals, assets, and audit for the team that fields hardware and access requests.
Try it with your own data
Create a workspace and set it up with your own teams, request types and settings.